Some Pre- and Post-Test Data from the CC Cert Course, December 2020
Caveat: Not the most recent version of this study!
What follows is the original version of this study, dating from December
of 2020. But
a newer version, dating from January, 2022,
is now available, please enjoy that one instead!
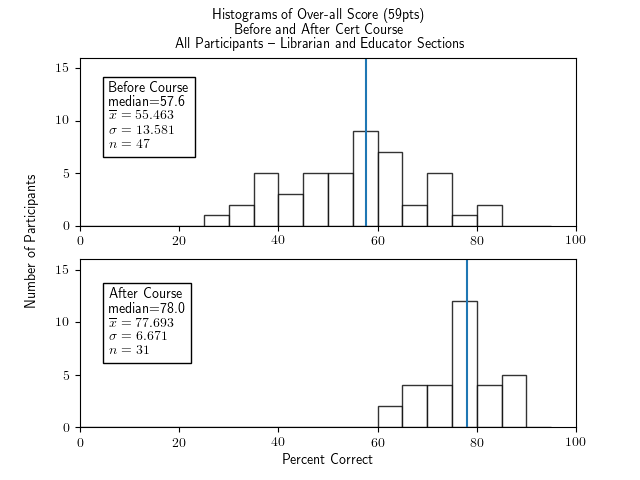
First, the over-all pre- vs post-test scores for all participants:
-
Whole test:
Next, the pre- vs post-test scores for all participants, for each
Unit of the course, separately:
-
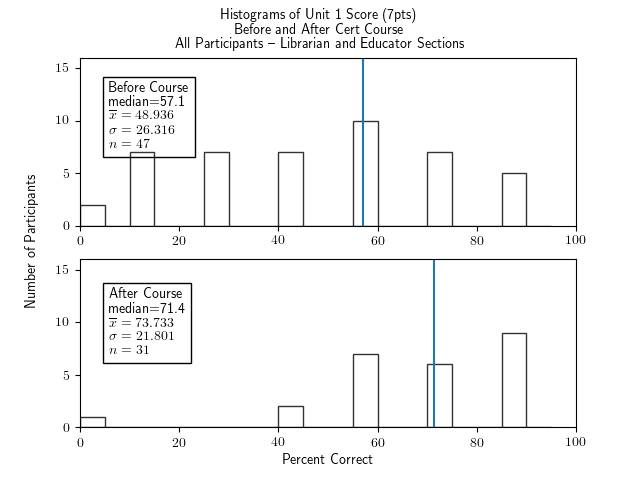
Unit 1: What is Creative Commons?
-
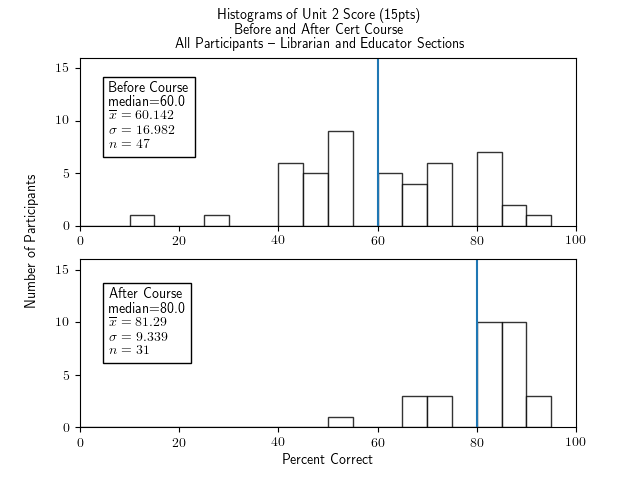
Unit 2: Copyright Law
-
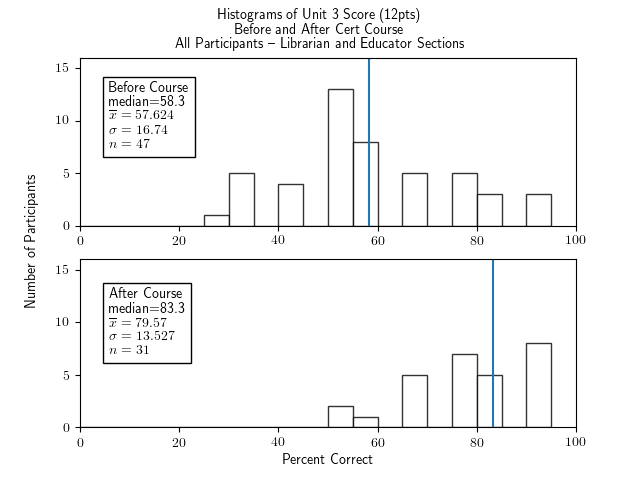
Unit 3: Anatomy of a CC License
-
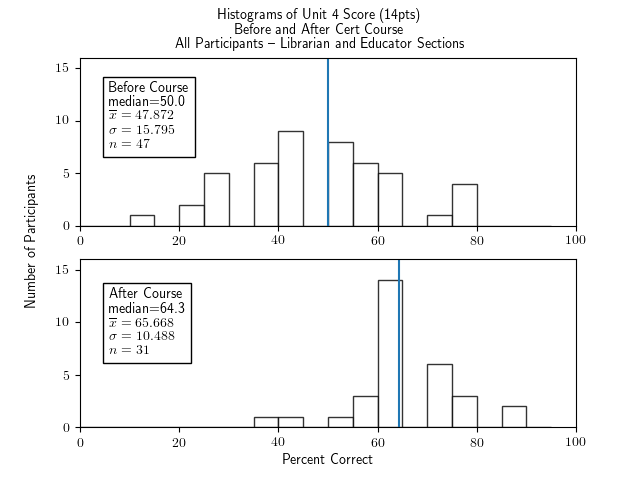
Unit 4: Using CC Licenses and CC Licensed Works
-
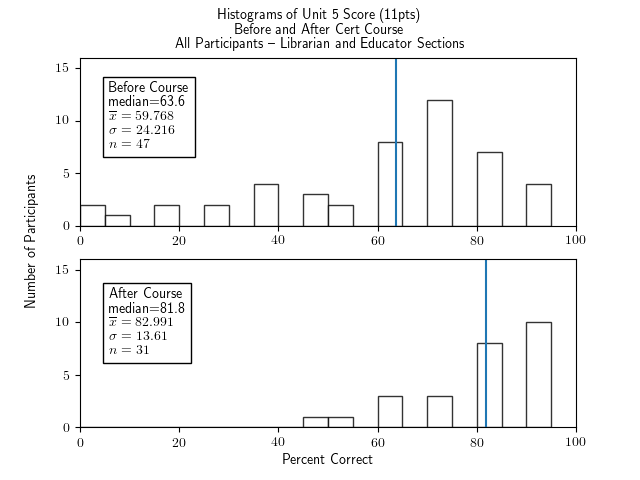
Unit 5: CC for Librarians/Educators (combined)
Finally, how about disaggregating the participant populations?
You may ask if the participants who choose to take the Librarian course
— presumably, mostly librarians — come to the course with
a different knowledge base from those who choose to take the Educator
course — presumably, mostly faculty (with a few other professions
thrown in)?
The answer to that is:
these two subsets are statistically indistinguishable.
Why? Well, first lets look at the over-all scores, disaggregated by
Librarian and Educator sections:
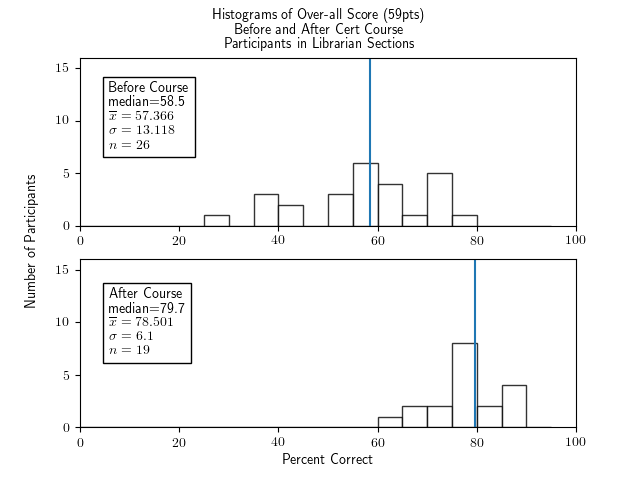
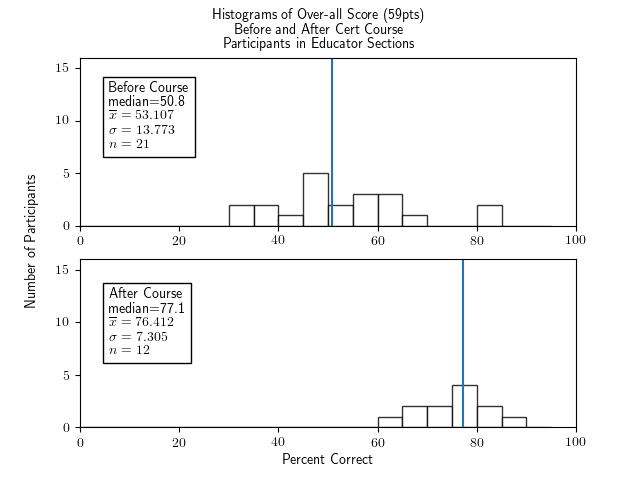
Come on, you say, those librarians are starting with a
higher pre-test score and ending with a higher post-test score.
There are two problems with that:
-
There is variability in the scores, so the slightly higher average
and median for librarians might just be due to this random variation.
We can do a T-Test of Independent Population Means to test this,
and it determines that:
These samples provide insufficient evidence to reject the null
hypothesis that the pre-test averages of these two groups are the
same in favor of the alternative hypothesis that the librarians'
average is higher, with a p-value of .1492.
[And in fact the p-value is .2984 when using the
alternative hypothesis that the two groups simply have a
different average.]
[That's a statisticians' way of saying that there is very, very
little statistical evidence of this difference being anything other
than random variation in these particular samples. The quantification
of how weak the evidence is comes from that p-value, which is
a number in the range from 0 to 1 and the larger it is, the weaker the
evidence. A typical cut-off for a result to be considered
the typical cut-off for a result to be
statistically significant. is p=.05, and we're well
above that here.]
-
But even the post-test scores are higher, you cry. Well, after
both groups go through the cert course, they are no longer
independent: they've both had the same treatment (the cert
course) and have even interacted with each other in the common course
Slack channel. The T-Test only applies to
independent samples, so we cannot use it again. And, in fact,
if everyone does better after taking the course, then we would expect
that if a random group of librarians just happened to start out with a
higher average score than another random group of folks taking the
educator version, then of course they will both have scores that go up
after taking the course, probably by around the same amount, so that
random group of librarians will end up with a higher average post-test
score. [Whew!]
Let's look at the disaggregated participant populations (librarians'
section and educators' section), disaggregated by each unit!
Maybe there is a statistically significant difference in these two
population at least with respect to how they do on particular units....
[Also, I just like saying the word disaggregated.]
-
Unit 1 What is Creative Commons?:
-
Librarians:
-
Educators:
-
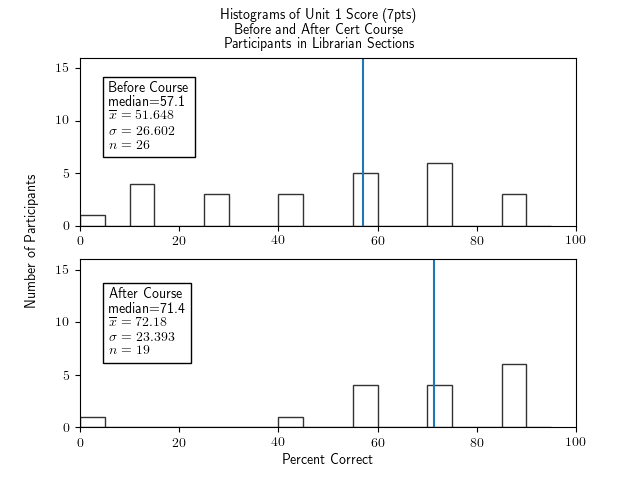
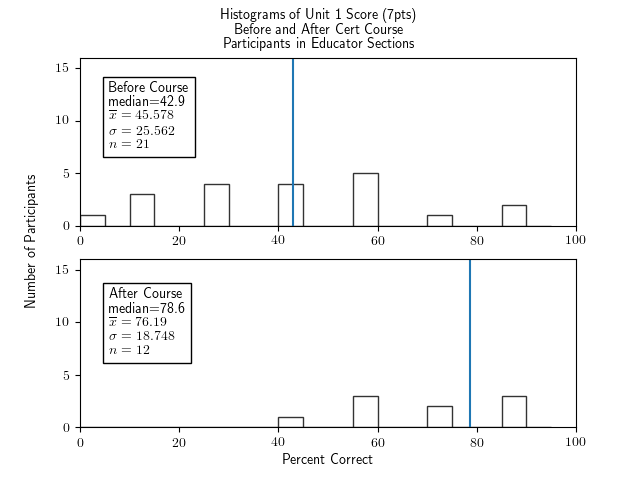
There is again no statistically significant difference in
pre-test scores on Unit 1 material between librarians and
educators; the p-value=.2172 in the one-tailed
test [and, of course, twice that in the two-tailed test].
-
Unit 2: Copyright Law
-
Librarians:
-
Educators:
-
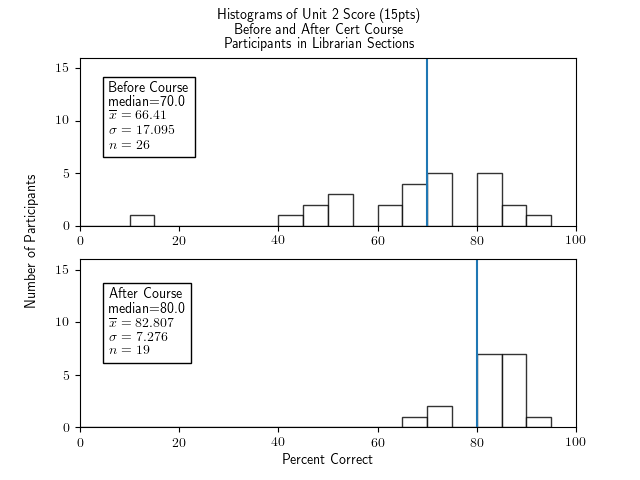
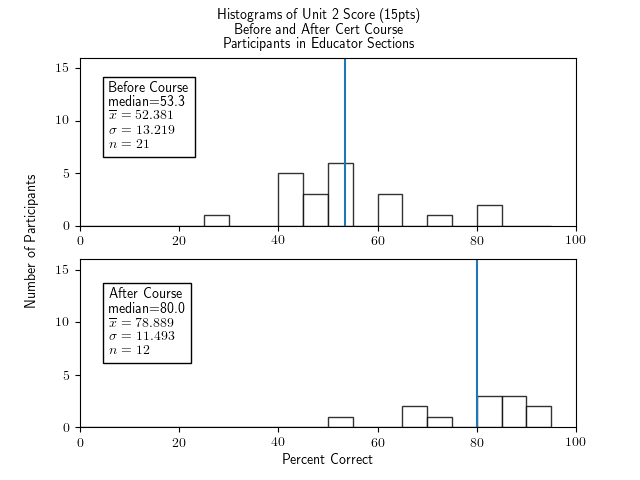
Here we have the exciting difference in this study that, as a
statistician would phrase it:
There is strong statistical evidence, with p=.0015
that folks who will take the librarians' version know more
about Unit 2 material before taking the cert course than do
those who will take the educators' version.
But this is not all that exciting, actually: presumably most of
those heading for the librarians' section are librarians, and
presumably librarians know more about copyright law than do others
in the general area of education.
-
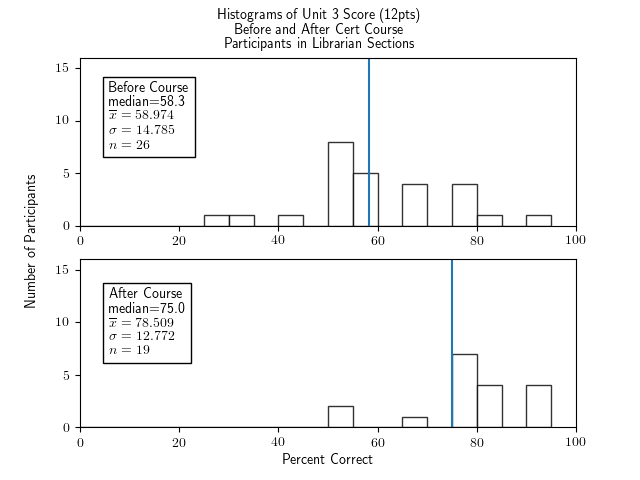
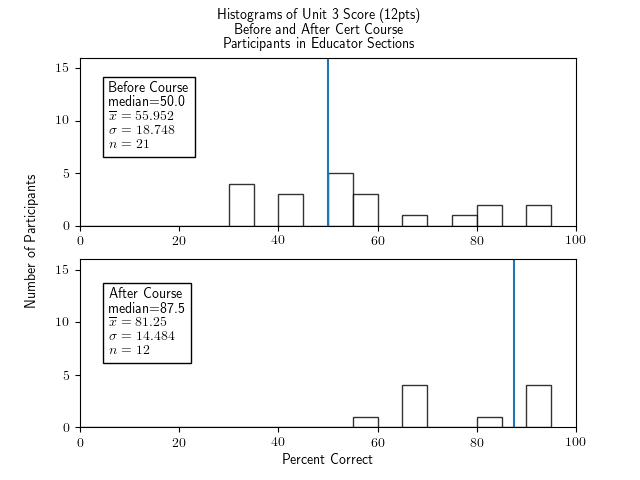
Unit 3: Anatomy of a CC License
-
Librarians:
-
Educators:
-
There is again no statistically significant difference in
pre-test scores on Unit 3 material between librarians and
educators; the p-value=.2767 in the one-tailed
test [and, of course, twice that in the two-tailed test].
-
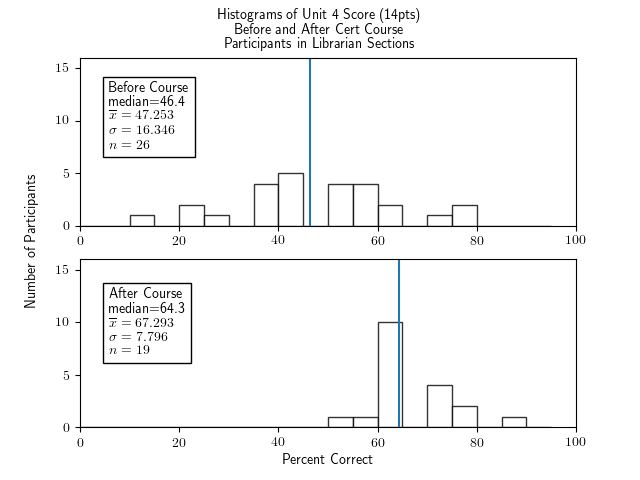
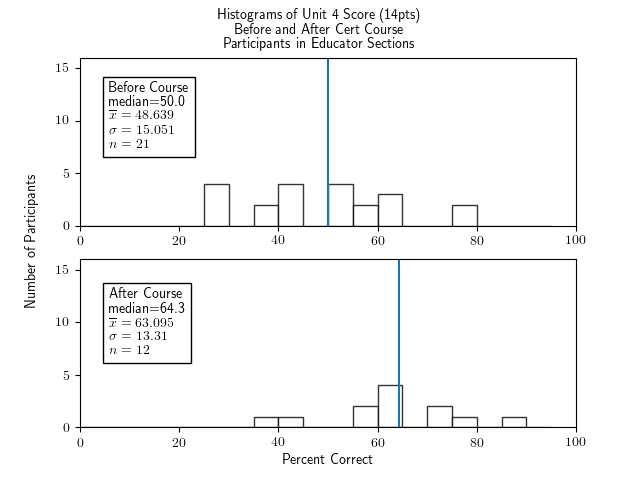
Unit 4: Using CC Licenses and CC Licensed Works
-
Librarians:
-
Educators:
-
There is again no statistically significant difference in
pre-test scores on Unit 1 material between librarians and
educators; the p-value=.3716 in the one-tailed
test [and, of course, twice that in the two-tailed test].
-
Unit 5: CC for Librarians/Educators (combined)
-
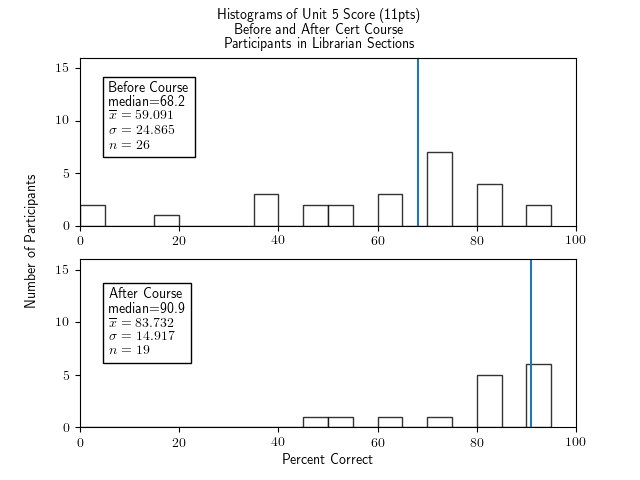
Librarians:
-
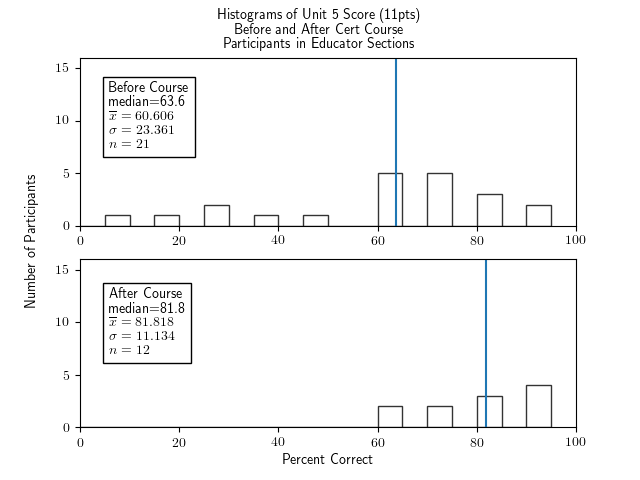
Educators:
-
There is again no statistically significant difference in
pre-test scores on Unit 1 material between librarians and
educators; the p-value=.4164 in the one-tailed
test [and, of course, twice that in the two-tailed test].
-
Anyone who still has an eye firmly on the details might ask why
we don't disaggregate even further in the Unit 5 questions, to those
which are strictly associated with the librarians' version of Unit 5
and strictly associated with the educators' version of that unit.
The answer is: wow, great eye for detail! Yes, we should do that,
although I doubt we'll get anything all that important or actionable.
But stay tuned to a statistics channel near you for a brand new
episode on this very topic some time soon!